Case Study 06
Automated Business Reporting Dashboard
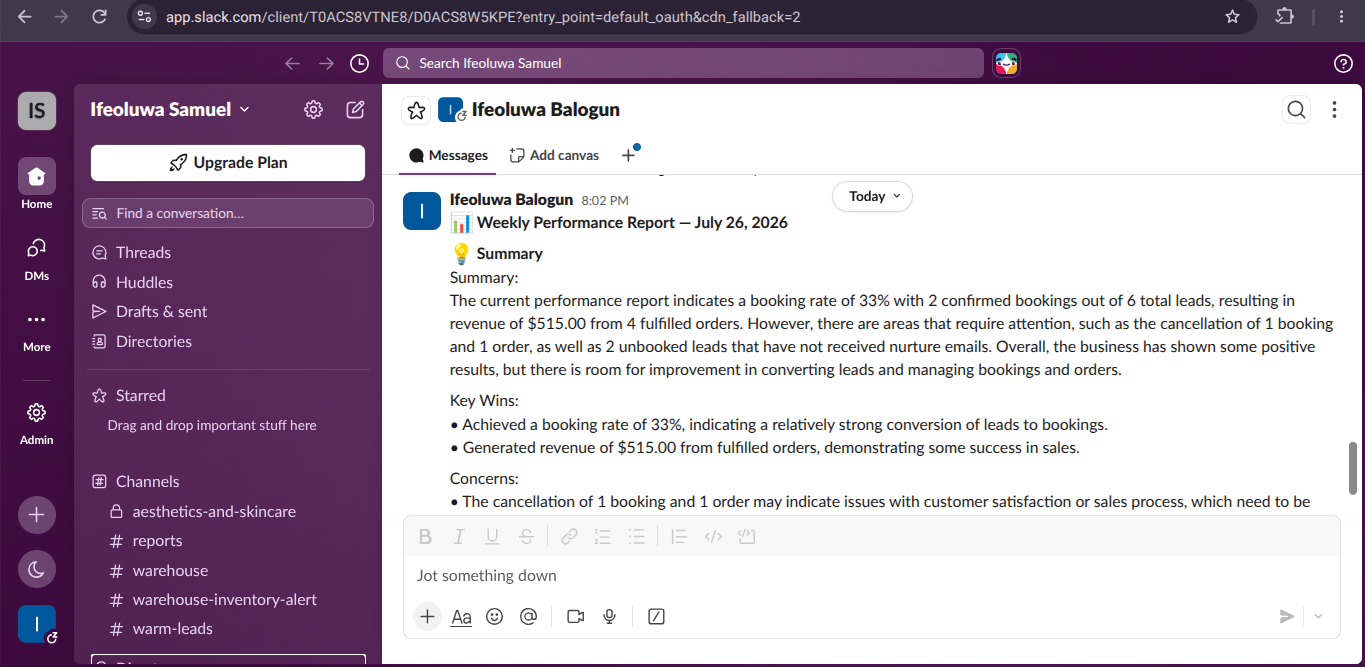
Aggregates data from multiple business systems every Monday morning, generates visual charts, produces AI-written executive insights, and delivers a fully formatted HTML report to the owner's inbox automatically.
- n8n
- Airtable
- Google Sheets
- Groq AI
- QuickChart API
- Gmail
- Slack
- JavaScript
The business problem
Weekly reporting meant opening Airtable and several Google Sheets, copying figures into a summary, building a chart or two, and writing a commentary from memory. It took most of a Monday morning, the numbers were calculated slightly differently each week, and because it was tedious it was often skipped entirely, leaving the owner making decisions on stale information.
The solution
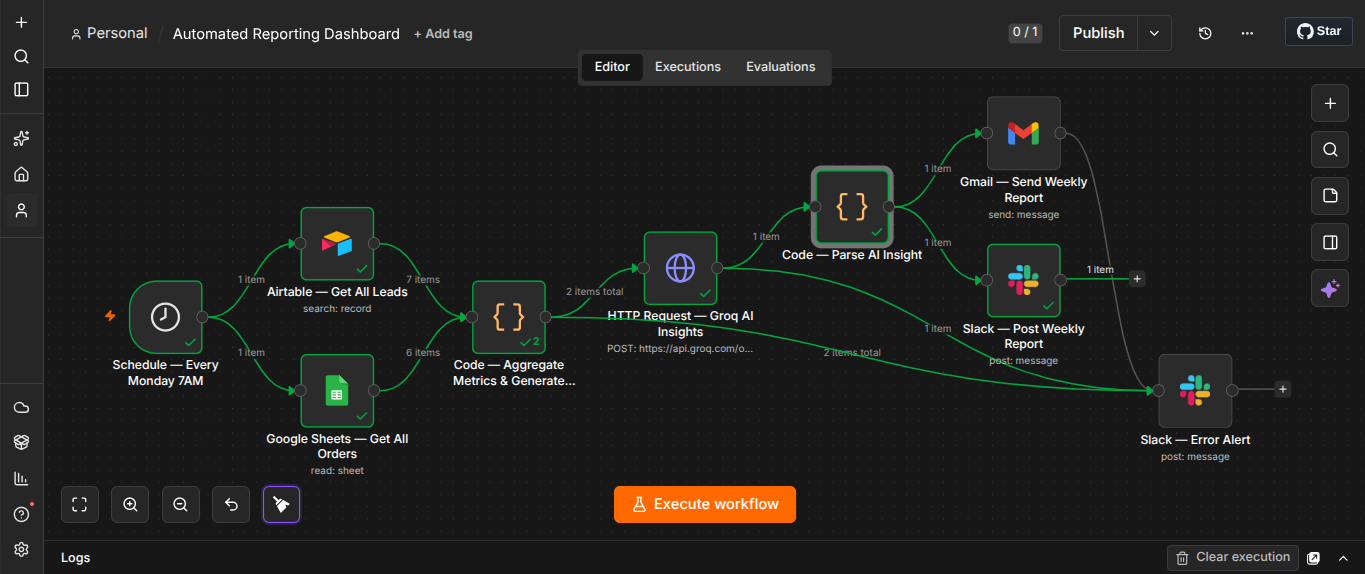
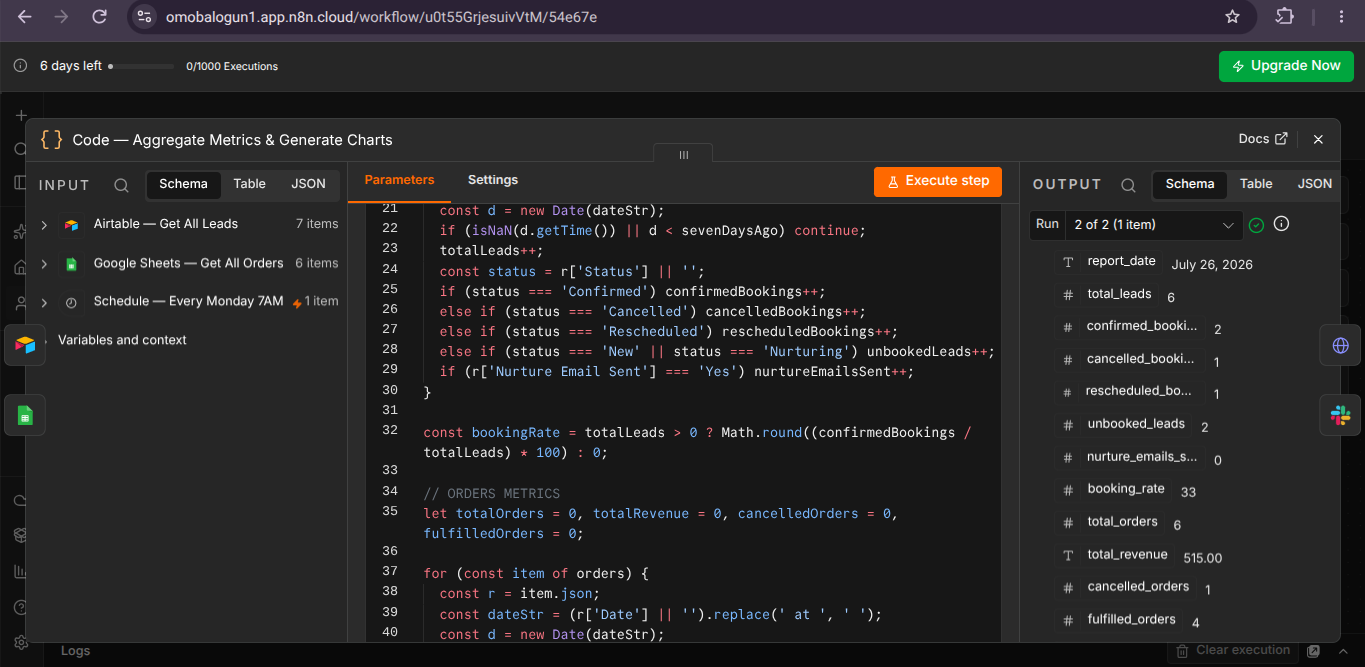
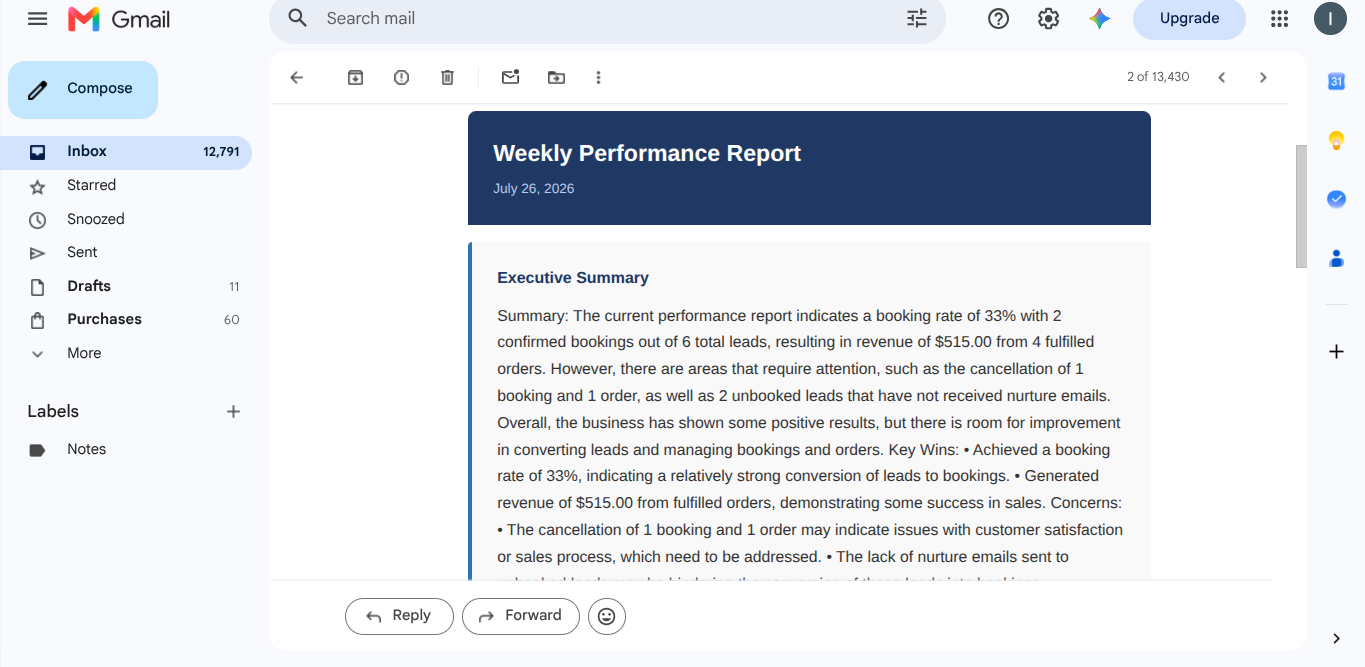
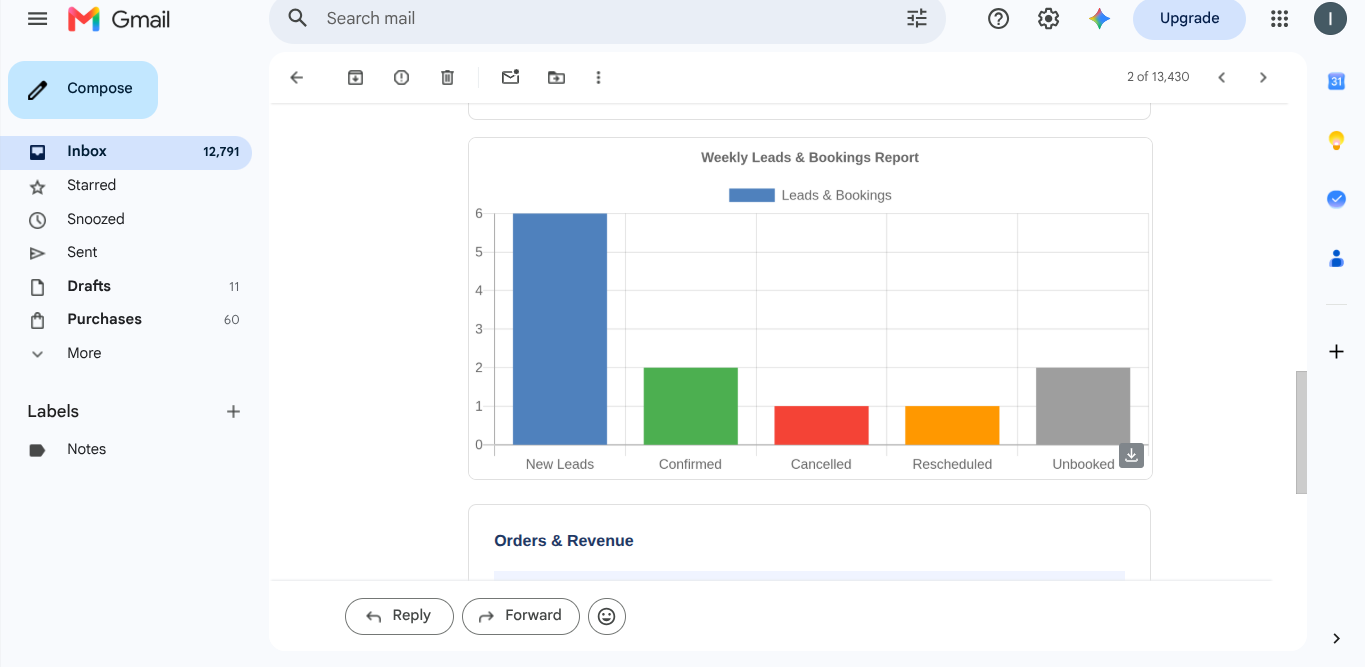
A scheduled n8n workflow runs early every Monday. It pulls records from Airtable and Google Sheets in parallel, merges them, and aggregates the week's metrics in a JavaScript node using one fixed set of definitions, so the numbers are calculated the same way every time and are comparable week to week. QuickChart renders bar and pie visuals from the aggregated figures, Groq AI turns the same data into a short executive summary that flags what moved and why it matters, and the whole thing is assembled into a styled HTML email delivered to the owner's inbox with a copy posted to Slack.
Walkthroughs for this build
Want a system like this in your business?
Every build starts with a short conversation about where the manual work actually lives.
Book a Discovery Call